UPDATE 2021-04 -- I noticed that some time ago, on an update that was released in very late 2020, they've changed the OID for the vti interface. This might be something on my end, but I suspect it's on Unifi's doing. The vti0 (virtual, tunnel, VPN) interface changed from .7 to .8 - which means changing a half dozen items in the template. The template attached here now works for me, but there may some variability at your end. Run an snmpwalk to confirm for yourself on your equipment
Ubiquiti make a bunch of networking products, including the Unifi range of gear.
The Unifi Security Gateway (USG) is one of the more popular -- giving the user an enterprisey level of insight and control over their border devices.
But one question that pops up frequently is how to monitor bandwidth from it, using third party tooling. The device, and the management software that comes with it, gives you some good visualisations, but for longer term retention you need to extract and retain that data yourself.
Zabbix is a tool that can do this. It can pull the data in at whatever periodicity you want, retaining it for whatever duration you specify, and with Grafana on the front of it, you can generate some really lovely visuals.
And since the USG is just a GNU/Linux machine, we can use the standard OIDs described at www.net-snmp.org/docs/mibs/interfaces.html
I've prepared a Zabbix template that can be imported into Zabbix (tested on 5.x). It has hard-coded references for the standard interfaces, plus a single VPN tunnel.
If you've got multiple tunnels then you'll need to add those in yourself. Low-level discovery should work okay, but it's beyond my humble needs.
Actually, my main interest in generating graphs of bandwidth utilisation out of the USG was so I could compare it to the data I am collecting via NetFlows coming out of the same USG. NetFlows are fantastic for diving into what is using your bandwidth out your pipe, and the USG supports v9 NetFlows out of the box. You can't use Zabbix to monitor NetFlows though -- for that task I use Elasticsearch, with Logstash, and the excellent Elastiflow from Rob Cowart
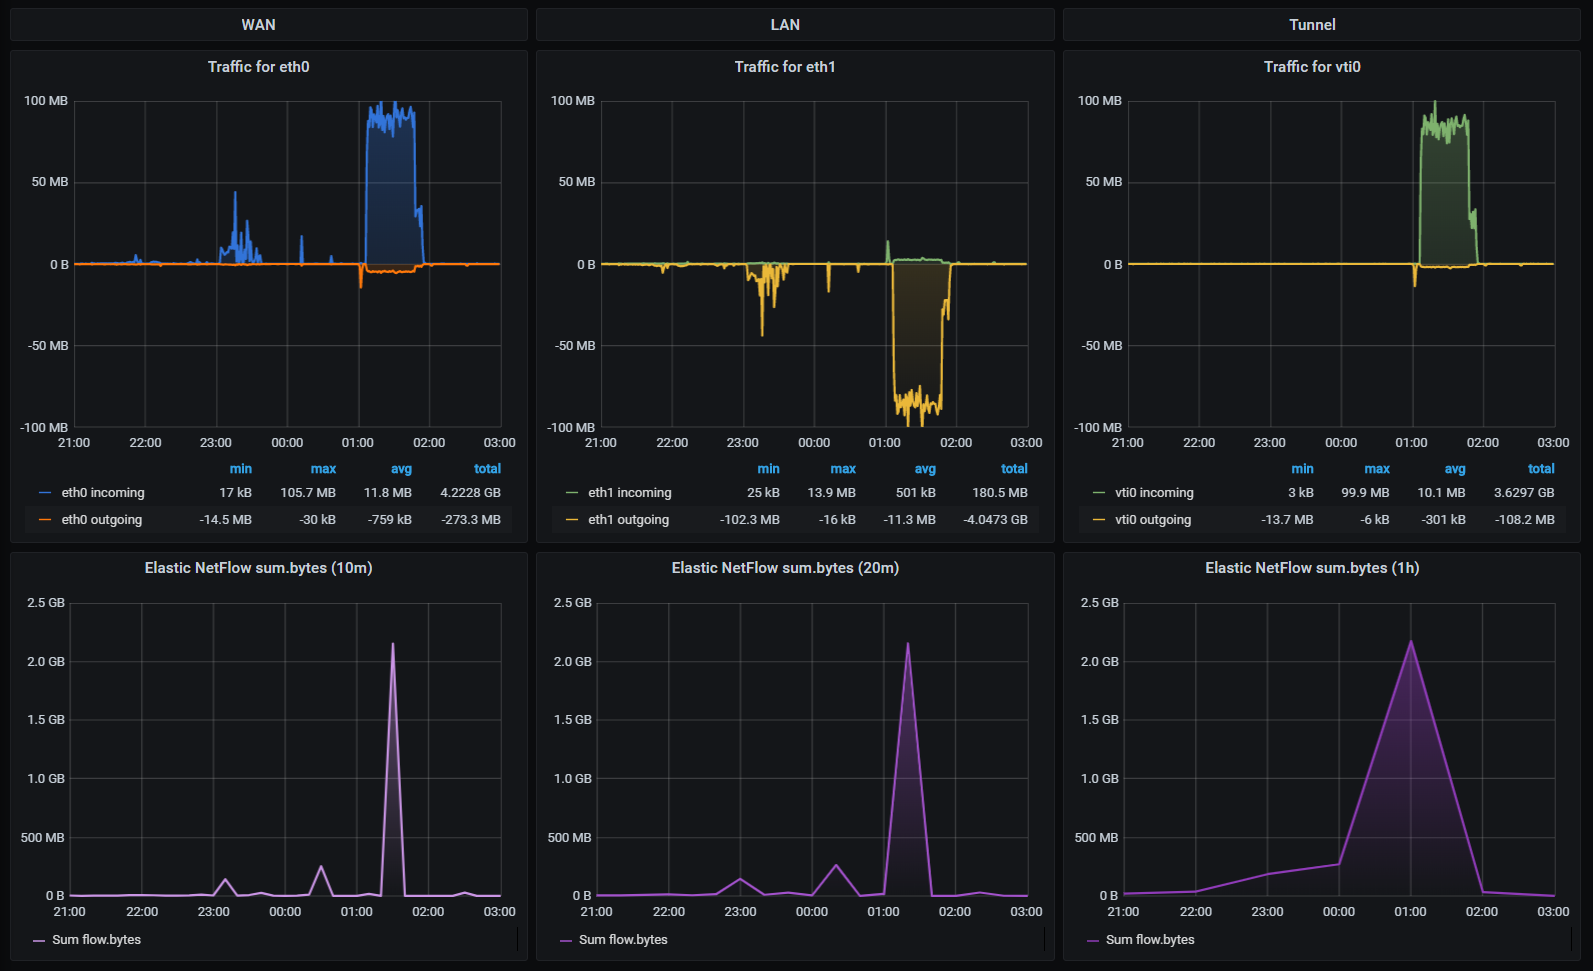
This means I can do a side-by-side showing of SNMP and NetFlow-based, with all the weirdness that often comes from this:
 Top row is Zabbix SNMP from USG - bottom is Elastic Netflow at various time-aggregations
In this instance we're looking at 9pm through to 3am for one of my sites. At ~ 1am I have a batch job kick off that syncs a bunch of data, one-way, and on this night it ran for just shy of one hour.
The WAN-in, LAN-out, and vti (tunnel) interfaces reflect this (the sync job runs over my tunnel).
Interestingly the WAN link is 25/5 Mbps asymmetric, and my routers don't do any kind of compression on the LAN side of the WAN interfaces (eg. Riverbed SteelHeads) so there's something odd going on with the reporting there.
Netflows typically need some interpretation. Here we're using full (not sample) data, but even so, sessions are not recorded throughout the flow, so often the data looks bunched up. This is exacerbated with long-lived connections, eg an rsync running over an SSH transport, over a VPN tunnel on the USG). In any case, grouping within the Grafana to show time-aggregations is a matter of playing around - the 'auto' setting is rarely satisfying, as it tries to give you too many datapoints, which perversely can lead to some odd looking graphs.